Goog Adsense

Monday, November 19, 2012

SPY - 2 year


SPDR S&P 500 (SPY), the State Street Global Advisors Electronically Traded Fund (ETF) that tracks the S&P 500 is the most widely used ETF index.  In looking at the last 2 years, we can see the 14 month bullish trendline was broken at $140.06.  It now is a potential free fall range to retest Tier 1 and possibly retest Tier 2.  So what does this mean?  

It means if one has an open position short, you stay short until you see how the SPY trades accordingly around the price of $125.28.  If the SPY manages to close below $125.28, then a test of Tier 2 level of $112.02 is probably imminent.  

On the opposite end of the spectrum, if one has an open position long, you may want to way the risk/reward ratio.  Locking in profits now or maybe taking a small stop loss position would free up cash to position oneself to rebuy at Tier 1.  

Sunday, November 18, 2012

SPXS - 6 month chart


Direxion Daily S&P500 Bear 3X Shares (SPXS) broke it's downward trend on 26-September-2012 when it closed at $17.44.  It went almost a calendar month before it started to get a bid at $18.04.  By looking at Thursday's action (ie. 15-November-2012), it touched it's Tier 1 resistance point of $20.66.  A close above $20.66 would be needed before considering a retest of $26.04 from 4-June-2012.  

Thursday, November 15, 2012

GOOD - 6 month


A ChartCoach follower requested an analysis on Gladstone Commercial Corporation (GOOD).  GOOD was in a bullish trend since 1-June; however, the support Trendline was broken on 19-October at $18.35.  The stock is broken and it should retest the $17.00 Tier 1 level in the near future.  $17.00 would be a target price to add more shares to your portfolio. Or lock in profits now and re-initiate a position at $17.00.  Or short sale at the current levels and if you believe it will retest $17.00, one can see if it can hold the Tier 1 level and see if it breaks further.

Tuesday, November 13, 2012

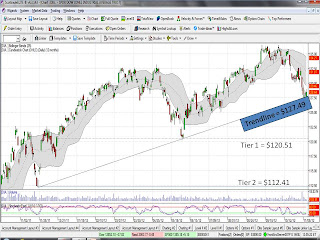
DIA - 1 year


As 2012 comes to an end, volatility in the equities should never be overlooked as investors, traders, and institutional holders prepare to take action to close the year end books.  Whether the investor is preparing for short-term capital gains/losses, the traders printing profits for their end of year bonuses, or even institutional holders positioning themselves for 2013, everyone has their own reason(s) for taking the action.  

Attached above is a 1 year of the SPDR Dow Jones Industrial Average (DIA) which is an ETF (Electronic Traded Fund) of the major index.  Although it's probably not the best indicator of the US Economy anymore (eg. compared to S&P 500, etc.), media and headlines alike love to focus on the action of this Old Yeller basket of stocks.  Looking at the start of the support Trendline which was on 25-November-2011 and the DIA was 112.14 (ie. Dow Jones Index was 11.2k), we can see it's built a nice support line up until now.  On 1-June-2012, it retested the support Trendline at 120.78 (ie. Dow Jones Index 12.1k) and today it has retested the support Trendline again with a close at $112.53 (ie. Dow Jones index at 12.56k).  Todays action has signaled a 2nd retest of the support Trendline confirming a 'Double Bottom'.  If the DIA does close below $127.49, it would confirm a break in the support Trendline, confirming a bearish downtrend to Tier 1 and Tier 2 support lines.  As the world awaits the US response to the 'fiscal cliff', action in the DIA may already be a preview of how the US stock markets will respond to Washington's solution to the 'fiscal cliff'.


Tuesday, November 06, 2012

ZNGA 6 month


Zynga Inc. (ZNGA) has been in a very bearish trend for 6+ months.  The current price of $2.24 is awaiting confirmation of breaking the resistance trendline at $2.48.  If it does, it could retest the Tier 1 price point of $3.28 and fill the gap all the way to $5.07 (see blue arrow.)  


Friday, November 02, 2012

COF 6 month


Capital One Financial Corp. (COF) continues to exert strength in the financials as it continues to make higher highs.  COF continues to be a strong player behind juggernaut JPM, which is still looking to break it's 52-week high established back in late March of this year.  

A break below the support TrendLine of $57.38 would signal a break in it's bullish pattern and should trigger a possible stop loss.  If and when that was to occur, it would be an opportunity to reevaluate the charts technicals.