Goog Adsense
Tuesday, November 13, 2012
DIA - 1 year
As 2012 comes to an end, volatility in the equities should never be overlooked as investors, traders, and institutional holders prepare to take action to close the year end books. Whether the investor is preparing for short-term capital gains/losses, the traders printing profits for their end of year bonuses, or even institutional holders positioning themselves for 2013, everyone has their own reason(s) for taking the action.
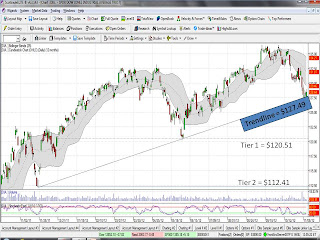
Attached above is a 1 year of the SPDR Dow Jones Industrial Average (DIA) which is an ETF (Electronic Traded Fund) of the major index. Although it's probably not the best indicator of the US Economy anymore (eg. compared to S&P 500, etc.), media and headlines alike love to focus on the action of this Old Yeller basket of stocks. Looking at the start of the support Trendline which was on 25-November-2011 and the DIA was 112.14 (ie. Dow Jones Index was 11.2k), we can see it's built a nice support line up until now. On 1-June-2012, it retested the support Trendline at 120.78 (ie. Dow Jones Index 12.1k) and today it has retested the support Trendline again with a close at $112.53 (ie. Dow Jones index at 12.56k). Todays action has signaled a 2nd retest of the support Trendline confirming a 'Double Bottom'. If the DIA does close below $127.49, it would confirm a break in the support Trendline, confirming a bearish downtrend to Tier 1 and Tier 2 support lines. As the world awaits the US response to the 'fiscal cliff', action in the DIA may already be a preview of how the US stock markets will respond to Washington's solution to the 'fiscal cliff'.
Subscribe to:
Post Comments (Atom)

No comments:
Post a Comment