Goog Adsense

Tuesday, December 18, 2012

MCP - 6 month chart


Molycorp, Inc. (MCP) continues to be in every traders arsenal as it has seen a lot of technical action in the last 6 months.  MCP has been stuck in a bear trap 4 of the past 5 months as it's bear trend was finally technically broken on 26-November-2012 at $8.68.  

For the last month, MCP has seen a nice dead cat bounce off a bearish reversal with a nice Trend Line from $6.00 to $10.20.  A break below it's current trend line would signal a potential retest of $6.00 so buyer's here should have a tight stop.  

MCP has major resistance at $11.05 (ie. Tier 1.)  If MCP were to close above $11.05, the next major resistance would be $16.07 which would complete a gap that it has needed to fill since 2-August-2012.  

Currently, the basic materials sector and other industry related companies have seen recent significant pressure as fiscal cliff looms.  While most major stocks continue to rise in anticipation of a resolution, there is still a lot of 'lack of' confidence in the commodity space despite the fact that more money printing would be part of the resolution which would in effect would expand the money supply.

Monday, December 17, 2012

SBX - 6 month chart


A Chartcoach watcher requested SeaBright Holdings, Inc. (SBX).  SBX has been a dead trade since gapping up on 28-August-2012.  SBX still has a long ways down to fill the gap at $8.27 which was the previous close before the move up.

Wednesday, December 12, 2012

NSR - 6 month


NeuStar, Inc. (NSR) has been very bullish since hitting a low of $30.08 back in June.  With a trend line that was retested on 1-Nov-2012 at $37.47, it continues to be very bullish.  Yesterday, 11-December-2012, it managed to break resistance and set an all-time high of $42.62 before closing at $41.97.  The stock did not disappoint today either as it set another all-time high of $43.29 before closing down at $42.34.  With a market cap of 2.81B and an EPS of 1.98, the stock may have a lot more room to run.  


Wednesday, December 05, 2012

FCX - 6 month chart


Freeport-McMoRan Copper & Gold Inc. (FCX) had serious technical damage today as it closed down 15.99% to finish the day off $6.12 points.  If we take a look at the previous 6 months, because the stock was up 35.71% from low to high, the charts may have warranted such a correction.  The first sign of danger was on 23-October-2012 when the stock closed at $38.98 when it broke it's trend line that begun on 25-July-2012.  Since breaking it's trend line, FCX came very near to retesting it's Tier 1 support line on 16-November-2012.  And much like it's retest of support line, today it came very close to it's Tier 2 Support line at $31.43.  Although FCX has some major repair coming it's way, FCX should be able to close the gap back to $38,28 especially under oversold conditions.

Monday, November 19, 2012

SPY - 2 year


SPDR S&P 500 (SPY), the State Street Global Advisors Electronically Traded Fund (ETF) that tracks the S&P 500 is the most widely used ETF index.  In looking at the last 2 years, we can see the 14 month bullish trendline was broken at $140.06.  It now is a potential free fall range to retest Tier 1 and possibly retest Tier 2.  So what does this mean?  

It means if one has an open position short, you stay short until you see how the SPY trades accordingly around the price of $125.28.  If the SPY manages to close below $125.28, then a test of Tier 2 level of $112.02 is probably imminent.  

On the opposite end of the spectrum, if one has an open position long, you may want to way the risk/reward ratio.  Locking in profits now or maybe taking a small stop loss position would free up cash to position oneself to rebuy at Tier 1.  

Sunday, November 18, 2012

SPXS - 6 month chart


Direxion Daily S&P500 Bear 3X Shares (SPXS) broke it's downward trend on 26-September-2012 when it closed at $17.44.  It went almost a calendar month before it started to get a bid at $18.04.  By looking at Thursday's action (ie. 15-November-2012), it touched it's Tier 1 resistance point of $20.66.  A close above $20.66 would be needed before considering a retest of $26.04 from 4-June-2012.  

Thursday, November 15, 2012

GOOD - 6 month


A ChartCoach follower requested an analysis on Gladstone Commercial Corporation (GOOD).  GOOD was in a bullish trend since 1-June; however, the support Trendline was broken on 19-October at $18.35.  The stock is broken and it should retest the $17.00 Tier 1 level in the near future.  $17.00 would be a target price to add more shares to your portfolio. Or lock in profits now and re-initiate a position at $17.00.  Or short sale at the current levels and if you believe it will retest $17.00, one can see if it can hold the Tier 1 level and see if it breaks further.

Tuesday, November 13, 2012

DIA - 1 year


As 2012 comes to an end, volatility in the equities should never be overlooked as investors, traders, and institutional holders prepare to take action to close the year end books.  Whether the investor is preparing for short-term capital gains/losses, the traders printing profits for their end of year bonuses, or even institutional holders positioning themselves for 2013, everyone has their own reason(s) for taking the action.  

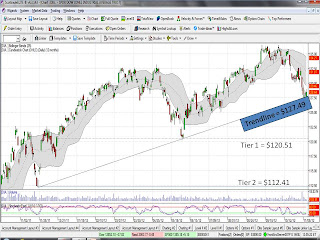
Attached above is a 1 year of the SPDR Dow Jones Industrial Average (DIA) which is an ETF (Electronic Traded Fund) of the major index.  Although it's probably not the best indicator of the US Economy anymore (eg. compared to S&P 500, etc.), media and headlines alike love to focus on the action of this Old Yeller basket of stocks.  Looking at the start of the support Trendline which was on 25-November-2011 and the DIA was 112.14 (ie. Dow Jones Index was 11.2k), we can see it's built a nice support line up until now.  On 1-June-2012, it retested the support Trendline at 120.78 (ie. Dow Jones Index 12.1k) and today it has retested the support Trendline again with a close at $112.53 (ie. Dow Jones index at 12.56k).  Todays action has signaled a 2nd retest of the support Trendline confirming a 'Double Bottom'.  If the DIA does close below $127.49, it would confirm a break in the support Trendline, confirming a bearish downtrend to Tier 1 and Tier 2 support lines.  As the world awaits the US response to the 'fiscal cliff', action in the DIA may already be a preview of how the US stock markets will respond to Washington's solution to the 'fiscal cliff'.


Tuesday, November 06, 2012

ZNGA 6 month


Zynga Inc. (ZNGA) has been in a very bearish trend for 6+ months.  The current price of $2.24 is awaiting confirmation of breaking the resistance trendline at $2.48.  If it does, it could retest the Tier 1 price point of $3.28 and fill the gap all the way to $5.07 (see blue arrow.)  


Friday, November 02, 2012

COF 6 month


Capital One Financial Corp. (COF) continues to exert strength in the financials as it continues to make higher highs.  COF continues to be a strong player behind juggernaut JPM, which is still looking to break it's 52-week high established back in late March of this year.  

A break below the support TrendLine of $57.38 would signal a break in it's bullish pattern and should trigger a possible stop loss.  If and when that was to occur, it would be an opportunity to reevaluate the charts technicals.

Saturday, October 20, 2012

AAPL 6 month


This is a brief alert on Apple Inc. (AAPL), there was major technical damage on Friday 19-October-2012.  Congratulations if you put that stop at 660 on AAPL If you took notice on my 2-September-2012 posting.  It looks like it's going to retest the 600 mark; however, taking a closer look,it broke through Tier 1 support of $622.57 on 1.6x volume.  The other technical damage was that the bullish Trendline uptrend since mid-May has been violated.  The prudent trader would probably sell on any upticks and look to re-position themselves at either Tier 2 support of $567.71.  

Thursday, October 11, 2012

GFI 6 month chart.


Gold Fields Ltd. (GFI) reference points:

1)  Support Trend Line:  $11.75

2)  Resistance at $13.25.

3)  Bearish pattern of lower highs:  $14.06 --> 13.93 --> 13.54


Tuesday, October 09, 2012

AMZN 6 month Chart


Amazon.com Inc. (AMZN) reference points:

Support Trend Line: $240.83.

Short Tier 1 (if there is a close below trend line):  $232.25

Short Tier 2 (and "Fill The Gap"):  $196.00

Thursday, October 04, 2012

ARUN 6 month chart


2 month upward trend of Aruba Networks, Inc. (ARUN) was broken on 20-September-2012.  This stock looks like a short to fill the gap.

Tuesday, October 02, 2012

PNR 6 month chart


Pentair, Inc. (PNR) looks like it's starting to receive some resistance at mid-40s.  Although very minimal in terms of cents, looks like a series of lower succession highs on 30-July, 21-August, and 28-September.  

Wednesday, September 19, 2012

10 oz Gold Bar Fraud

http://www.zerohedge.com/news/tungsten-filled-10-oz-gold-bar-found-middle-manhattans-jewelry-district

This story reinforces why one must buy from a reputable dealer.  The only problem in this case was that it was a legitimate bar, it just was altered.  This might further increase the demand for small coins or just smaller bars (ie. 1 oz, etc.) since it would be a little harder to manipulate them based on weight alone.

Friday, September 14, 2012

QE 3...um I mean QE~

The Fed officially put what might be the last nail in the coffin in sealing the US Dollar's fate by allowing itself to continuously print money until the economy gets back into satisfactory or compelling economic feasible levels.  The part I do not understand is how they're doing it.  They are again supporting and inflating the housing market by buying mortgage back securities in the hopes that US Citizens will be more wealthier on paper with their real estate assets and in turn take the equity they have in their homes and spend it in the market.  With the anticipation of appreciating real estate prices, home builders and real estate investors will once again come into the market buying up whatever they can.  Really?  Did we not learn anything in history on the latest housing bubble just 5 years ago?  That's very well a reason why history continues to repeat itself, since we keep making the same mistakes over and over.  Throwing good money at bad is never a good thing.

So if you're a homeowner and want to stay in your home, you'll be able to refinance that 30 year mortgage at historical low prices until you retire (or if you are retired, until you depart this life.)


Thursday, September 13, 2012

6 month chart for SLV and AAPL

Downward resistance was broken on 25-July-2012.  iShares Silver Trust (SLV) currently has an upward support line north of $32.  Look for a retest of 6 month highs of $36 in the near future.


Apple Inc. (AAPL) still demonstrating relative strength to overall market conditions.  Whenever a stock breaks out in a 52 week high, the caution flag should be raised as that is a sign to protect profits (eg. sell high buy low.)  Setting a stop at 660 would be prudent and possibly look to revisit a purchase at the support line of $600.  As much as I love AAPL products, I do think that AAPL is one of the biggest current bubbles.  


6 month chart on F


Downward trend on Ford Motor Co. (F) was broken on 13-August-2012.  The stock should be considered be held long until Tier 1 at $10.75.  We will re-evaluate support trend line to gauge what it needs to do to get to Tier 2.


6 Month of VLO and BIDU

Valero Energy Corporation (VLO) still in a bullish trend with a retest of the support line at $30.  Once VLO has retested the support line, VLO should make another leg higher breaking through it's 52 high of $33.60.


Baidu, Inc. (BIDU) in a bearish trend with resistance at $130 and a retest of the previous lows of $104.05.  Given that it's close to the lows and currently priced at a 17% discount relative to it's resistance at $130, it is better to avoid and wait for better entry point.


Tuesday, September 11, 2012

Friday, September 07, 2012

http://news.yahoo.com/judge-says-10-rare-gold-coins-worth-80-152750965--abc-news-topstories.html

Although I agree with the decision since it's most likely that "However, a Philadelphia Mint cashier had managed to give or sell some of them to a local coin dealer, Israel Switt." were transferred illegally.  Because the US went off the gold standard making owning gold coins illegal, what rights do precious metal owners own today?  What if the US confiscated gold again?  Or perhaps Silver?

Monday, September 03, 2012

Question:  if my trading broker goes bankrupt, can they use my money to pay off the debts? like in MF Global?

Answer:  When a company goes bankrupt, there's a pecking order the company must go through to liquidate their assets.  The bankruptcy laws usually help dictate where goes where, but it goes pretty much in this order from first to last:  special creditors, secured creditors, general creditors, stockholders (of tradeking.)  

The stocks/securities you own in your account are insured by SIPC.  SIPC:FDIC = Financial Institutions:Commercial Banks.  If TradeKing is anything parallel to Madoff, then you will receive nothing.  

Sunday, September 02, 2012

QE3???

Bernanke last week at Jackson Hole neither affirmed or denied whether QE3 (Quantitative Easing III) would  occur.  Because he did mention that the Fed would take action if needed, the markets, especially the commodities markets rallied in anticipation that another round of QE3 is in the horizon.  As an avid trader, one must not jump to conclusions and always look at both sides of the story on any news.  The main problem with the markets are that they are specifically looking for Big Ben to say, "QE3."  But what if he calls it something else like, "Blue Light Special Donation" or "Make A Wish Per Diem"?  Will the markets be as responsive in a bullish tone if the government prints more money adding further erosion to US Dollars?  I think Ben knows that using the dangerous letters QE are as bad as any four letter word.  Look for the Fed to call their next round of funding something else and not necessarily 'QE'.

Saturday, August 25, 2012

Silver's next move?

The all-time chart of the iShares Silver ETF is at a major point.  It's all-time uptrend is still intact as well as the downward move from the highs creating a pennant.  A break in either the downward support or the upward resistance will most likely establish a pattern for year(s) to come.  I believe it's going to be bullish based on Fed Monetary Policy, but anyone's guess at the moment.


Tuesday, August 21, 2012

The 2012 Election: Democrat versus Democrat

http://news.yahoo.com/paul-ryan-brings-mom-medicare-debate-130529058.html

It's officially been a week since Paul Ryan's announcement of him being selected as the running mate and he seems to be a deer caught in the Democrats headlights for both his prior and past actions.  Today's announcement about Ryan bringing his mom into the Medicare debate is just outright preposterous.  So Paul Ryan being the multi-millionaire that he is he would rather have the U.S. taxpayer pay for his moms healthcare (i.e. Medicare) than himself.  Just by that alone, someone please tell me how he's any different from Obama?  Ryan, the supposed Conservative, wants less government spending, less so-called handouts to those reaping the benefits of government entitlements, and he is debating on how Medicare is good for mom who needs to play tennis?  If I didn't know any better, I'd say he was a Democrat in Republican Sheepskin.

The 2012 election is turning into a battle for Medicare.  The reason why this is dangerous for the Republicans is because they cannot win this battle.  The Republicans should be cutting Medicare expenses immediately (i.e. 2013) and disclosing to the U.S. Citizen how this plan was never good from the get-go and that it's just a matter of time (i.e. < 5 years?) before the system implodes itself.  But No, the Republicans fear the full disclosure, because that means less votes for them, especially for those who are using Medicare.  The 2012 election should be about saving the U.S. Economy and beginning the road to recovery.  Maybe Ryan and Paul really have no idea how difficult it is out there for most Americans, much like most pro athletes are oblivious how difficult it is out there financially for the common folk.

Tuesday, August 14, 2012

Betting Odds on Paul Ryan

http://en.wikipedia.org/wiki/Paul_Ryan

Paul Ryan IMO was probably the best running mate Mitt Romney could have selected from the pool of candidates; however, that is the equivalent of picking the less rotten apple from a bushel of rotten apples.  Offshore gambling websites immediately reflected the odds of the Political Race:  Democratic -195 Republican +165.  Prior to announcement of Paul Ryan the odds were Democratic -190 Republican +160.  Although the odds do not seem much, oddmakers have the Democratic Party has a 1:2 favorite to win this upcoming election.  Being that I have Republican beliefs, but find myself leaning more towards the Libertarian Party, I believe the oddsmakers are being fairly generous on the -195.  It's too bad Rand Paul was not selected as the running mate, but than again Rand Paul was not even in consideration from the pool of candidates.

Saturday, July 21, 2012

http://www.reuters.com/article/2012/07/11/us-finra-suitability-idUSBRE86A0ND20120711

The above link is a new FINRA rule that goes into effect Monday.  To sum it all up, it holds broker/dealers/advisers accountable for ANY recommendations they disclose even if the prospect/client doesn't even have an account held with them directly.  This should have a huge impact on just about any licensed professional telling you they have a *HOT* stock tip.

Friday, July 20, 2012

CMG released earnings yesterday and the stock got crushed right from the get go this morning.  Being an employee of a food service competitor, I believe with the increase of commodity price inflation, it will be very difficult for any of these food services to maintain their level of profitability for a very long time.  However, they do have pricing power so that they can subsidize their commodity price inflation in their sales items.  Here is a maximum chart since inception of CMG and where long-term holders will want to consider picking up the stock.  From my support line, it looks like $200 is where the stock needs to retest the technical 'long' guys start throwing money at it again.


Thursday, March 15, 2012